The S&P 500 has so far registered a positive total return in 2018, though it is a slight one. A good deal of the market’s anemic return can be explained by what has become a somewhat bifurcated market, with technology shares being the best performing sector year-to-date, and consumer staples being the worst performing sector. In fact, the total return spread, – as measured by their sector ETFs – XLK for tech, and XLP for consumer staples, – has surpassed 2,000 basis points, with XLK returning almost 9% through May 21st, versus a decline approaching 13% for XLP.
This divergence is not just the result of a few stellar performers in technology, and a few large consumer staples stocks getting trounced; the 2018 performance spread for PowerShares’ equal-weighted technology (symbol RYT) and consumer staples (symbol RHS) sector ETFs has also widened to more than 2,000 basis points. Amazingly, the strength in technology stocks has been so strong this year that of the sixty-nine components of RYT, only ten are negative for the year. Conversely, the weakness in consumer staples stocks has been so pervasive that only eight of the thirty-four components in RHS are positive.
The disparity in performance between these two sectors is nothing new, either. As can be seen in the chart below, both sectors have led and lagged the market at different times over the last thirty years. However, what makes the relationship somewhat unique is its inverse nature: one sector has tended to lead the market at the same time the other has lagged it:
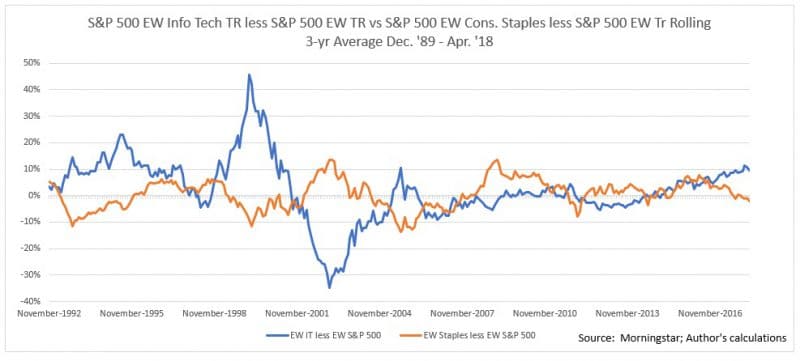
The inverse correlation for the two series over the full period is -45%, which suggests that the average tech stock portfolio has tended to do very well while the average consumer staple portfolio has done poorly, and vice versa. This suggests that the current cycle is historically very normal.
These relative movements have had a tangible impact on valuations, too. As a proxy for the valuations of the average tech and consumer staple stocks, we can use the valuation data for the equal-weighted portfolios of each sector’s constituents. This analysis shows that the equally-weighted tech portfolio trades at almost twenty-nine times profits for the most recent twelve months’ through April, an astounding 40% premium to the S&P 500. The equally-weighted consumer staples portfolio, on the other hand, stood at a bit more than seventeen times earnings, or a 15% discount to the market. Both the hefty premium valuation for tech, and the discounted valuation for consumer staples, hold true even when comparing the average tech stock and the average consumer staple stock with the average S&P 500 constituent:
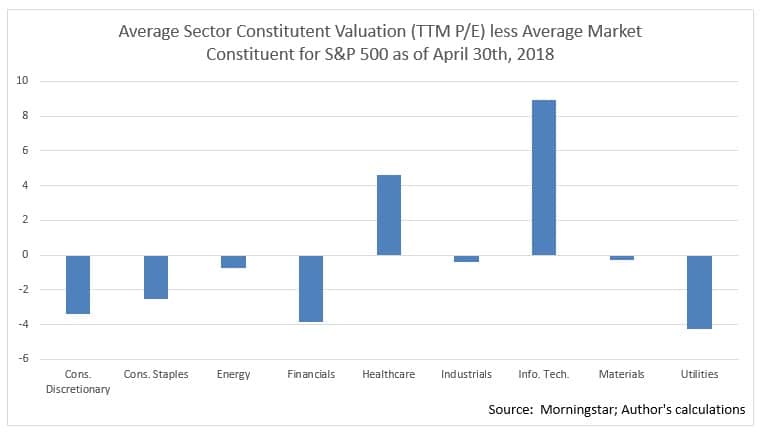
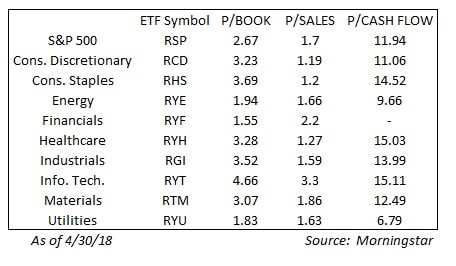
Using other valuation metrics shows that tech stocks, on average, appear to be the most expensive segment of the market, while consumer staples stocks, – while by no means the cheapest sector, – are more reasonably priced:
The devastating price action in consumer staples stocks has been such that sentiment on them has now turned extremely bearish, which, as CNBC’s Michael Santoli pointed out in a recent column, has pushed the forward price-to-earnings ratios for stocks like Colgate-Palmolive, Procter & Gamble, and General Mills to their lowest relative (to the S&P 500) valuations in many years. The last time a market segment was the subject of so much pessimism, Mr. Santoli writes, was last year, when brick-and-mortar retailers were seen as toxic investments due to the disruption caused by Amazon in their industry.
However, I would argue that many consumer staples stocks do not face such a dire future, even if their valuations reflect that sentiment. It seems unlikely that, even with stiffer competition from new market players, these well-known brands will ever disappear from American households. On the contrary, the combination of steeply discounted valuations and extreme pessimism may be the perfect foundation for a solid rebound in consumer staple stocks.
Addendum: Valuation data based on forward earnings estimates shows a different picture from TTM P/E: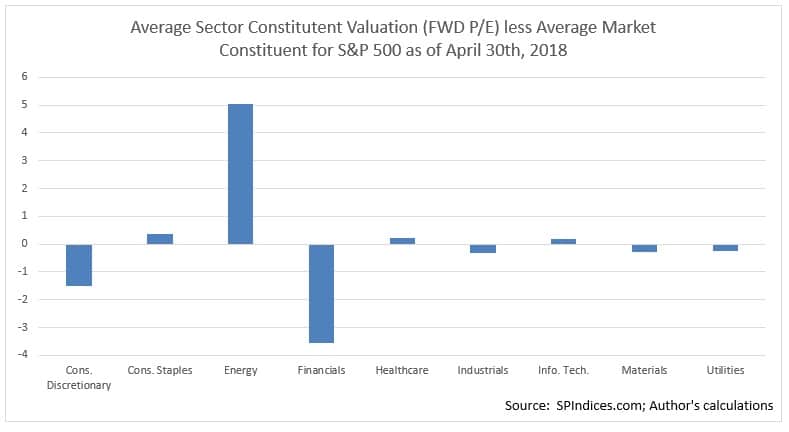
Clients of Fortune Financial Advisors, LLC hold positions in XLK, XLP, RHS, RYT, CL, PG, GIS, and AMZN.