It has long been a belief of mine that the industry in which a company operates has a huge impact on its performance, and that most industries simply are not worthwhile for long-term investment consideration. To further this discussion, I took the detailed industry data found in Professor Ken French’s data library, and analyzed the performance of each over the fifty-year period ending in November of 2019.
Before jumping into the analysis, I should offer a few caveats regarding the data. First, the data for some of the industries is skewed by Professor French’s somewhat unique grouping decisions. For example, to create the ‘transportation’ industry portfolio, historically poor performers like airlines and freight shipping were amalgamated with a historically strong performer, railroads. Were groupings like these to be broken out and analyzed separately, the results could change materially. Secondly, I have decided to focus my analysis on risk-adjusted returns as I believe that this is a better measure of whether an industry and its constituents really delivered exceptional performance over time versus the market. For our purposes, the ‘market’ is represented by Professor French’s “Hi 30” portfolio, or the largest 30% of stock market capitalization. For unfamiliar readers, the “Hi 30” portfolio is a fair proxy for the S&P 500, which usually represents the market in analyses such as this.
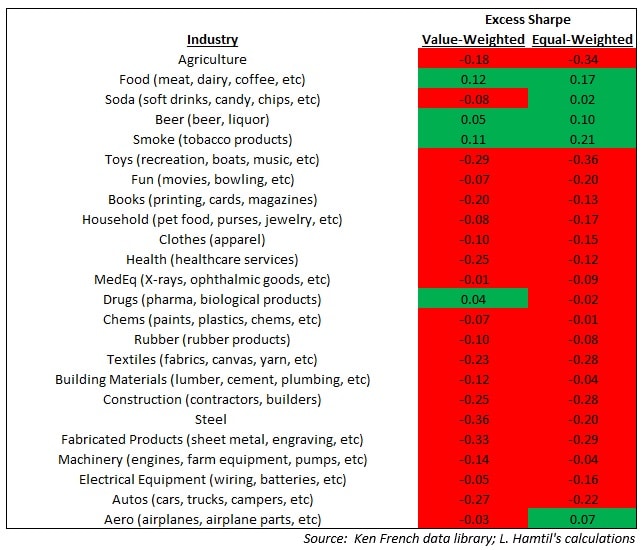
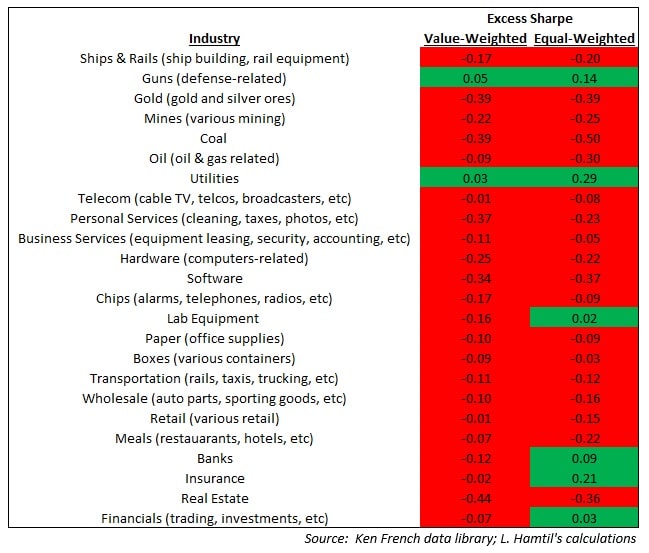
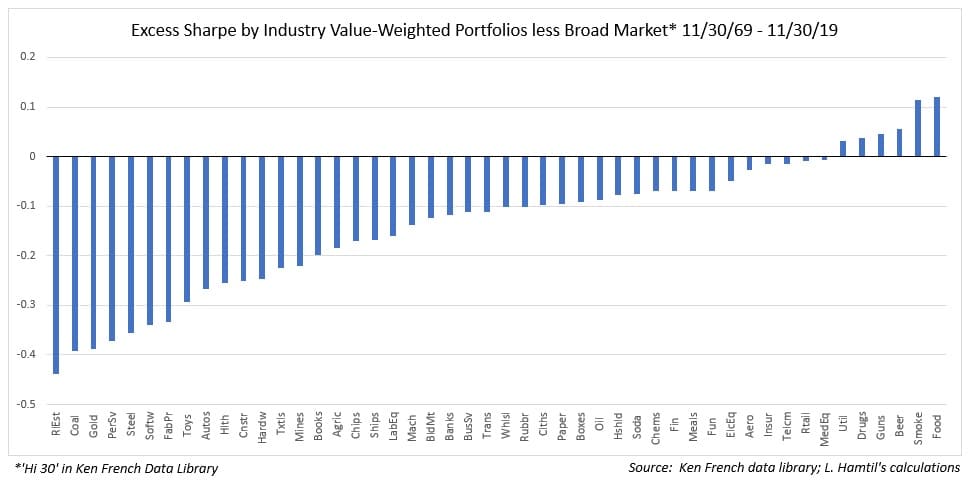
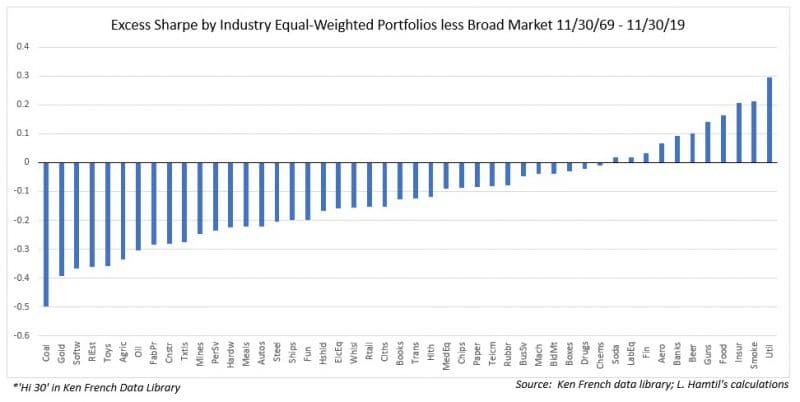
Now, the data. The first chart shows that of the forty-eight industry portfolios considered on a value-weighted or market capitalization basis, only six boasted a higher Sharpe (i.e. had higher risk-adjusted returns) than the broad market: ‘Smoke’ (tobacco-related), ‘Food’ (meat, dairy, etc), ‘Beer’ (alcohol-related), ‘Guns’ (defense-related), “Drugs” (pharma and the like), and Utilities.

To be fair, one possible issue with these results is that a few exceptional companies in these industries may skew the results, such as Philip Morris in tobacco. To account for this possibility, I performed the same analysis on the equal-weighted versions of these industry portfolios. Interestingly, the risk-adjusted returns actually improved in all but one (‘drugs’) of the outperforming industries, suggesting that these industries are indeed truly exceptional, and not just riding the coattails of a few superstar stocks:
What do these few outstanding industries have in common? They are generally not capital-intensive, meaning they do not require a lot of investment to grow, have stable earnings streams, and, perhaps most importantly, generally have wide moats that insulate them against competition. Furthermore, they are generally consistent performers, by which I mean their performance is not the result of a one-time mega cycle that elevated their industry.
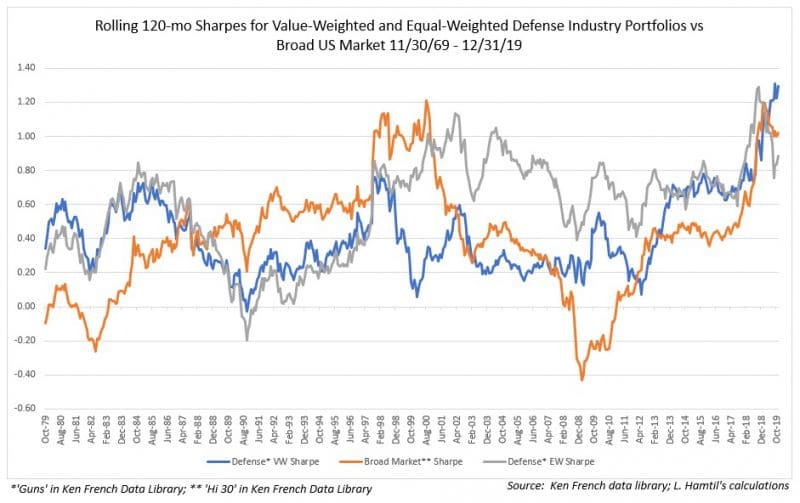
For example, whereas the broad market suffered two ten-year periods of a negative Sharpe over the last fifty years, both the value-weighted and equal-weighted defense portfolios suffered just one around the time of the end of the Cold War:
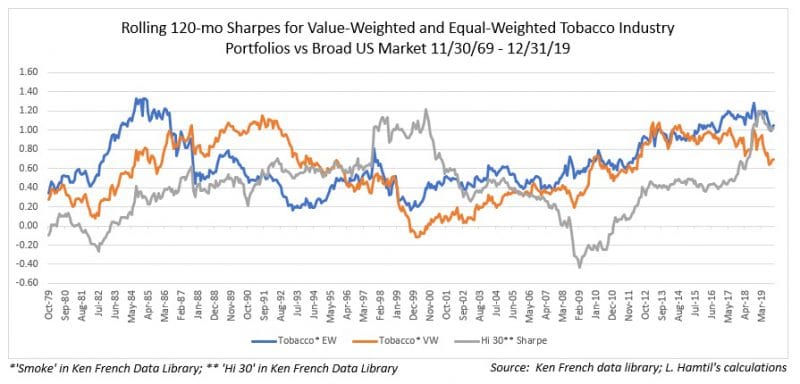
The results for the tobacco portfolios are generally the same, with one period of negative risk-adjusted returns for the value-weighted tobacco portfolio, but, somewhat astonishingly, none for the equal-weighted tobacco portfolio:
Another important consideration when analyzing why these industries demonstrated exceptional performance is valuation. Rarely have these exceptional industries been overvalued to the extent that subsequent ten-year returns were muted if not negative. In fact, the opposite has largely been true; defense stocks and tobacco stocks, for example, have often traded at a discount to the broad market. In contrast, the soda industry, which is a stable, capital-light industry dominated by two players with wide moats, Coca Cola and Pepsi, actually exhibited a negative excess Sharpe on a value-weighted basis, as the industry became a victim of frothy valuations in both the early 1970s and late 1990s. Put another way, unsustainable valuations can more than offset the advantages of a wide moat and a capital-light business model.
A second revelation to me in analyzing the data is that while equal-weighting with its implied periodic rebalancing will reduce one’s exposure to ‘compounder’ stocks that exhibit outstanding growth over time, it also reduces the risk of concentration in a few names that is sometimes the result of undisturbed compounding.
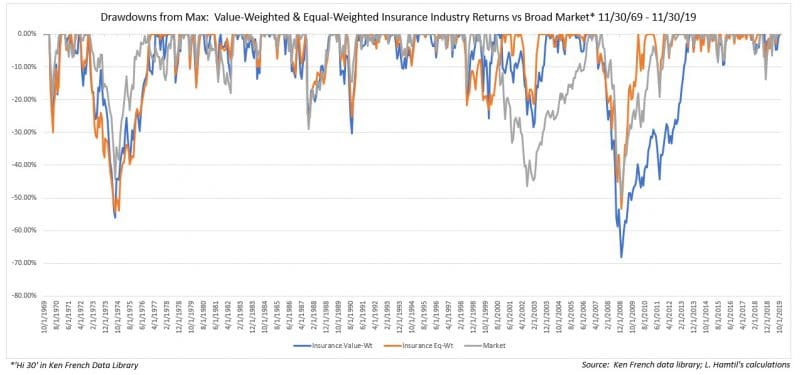
Consider the case of the insurance industry. On both a value-weighted and equal-weighted basis, the industry outperformed the broad market, but in risk-adjusted terms, only the equal-weighted insurance industry portfolio outperformed:

Why was that the case? Prior to its near collapse in the fall of 2007, AIG was one of the largest insurers in the world and a ‘Dow 30’ stock. It had to be bailed out by the federal government in order to survive, and its large weighting in the value-weighted insurance index was largely responsible for a near 70% peak-to-trough drawdown which took years to make good. The equal-weighted insurance industry portfolio, in contrast, suffered a much less severe decline and recovered much more quickly as a result of its evenly spread bets:
A similar phenomenon played out in the utilities space, with the equal-weighted utilities portfolio outperforming the value-weighted portfolio, which was rocked by the collapse of Enron in 2001.
In sum, these data support the argument that there are really just a few exceptional industries in which to invest one’s capital for those willing to deviate from the index portfolio. Of course, these data are backward-looking, and they tell us little about how the future will look for these industries. Yet the past may not be as poor a guide to the future as some argue. I, for one, think it is important to see that business models have demonstrated durability over periods long enough to subject them to various headwinds. Once it is understood what has propelled them to exceptional performance, investors must gauge whether these factors will still be tailwinds going forward.
Appendix: Detailed industry definitions and excess Sharpe data