The 20th century ended with a bang with U.S. equities peaking on March 24th, 2000 with the apex of the tech bubble. Only in the last few years have major market averages such as the Dow Jones Industrial Average and the S&P 500 index significantly surpassed the levels initially reached then. What is more, the real trade-weighted dollar index has more or less completed a cycle of its own, ending last year little changed from where it was in the spring of 2000:

An investor who allocated his money across the global equity spectrum – S&P 500, developed world ex-U.S., and emerging markets – at that time, and who revisited his portfolio only at the end of 2016 would be pleased: returns across the globe and across most sectors, – tech being the obvious exception, – were very healthy:

Yet we know in reality that the performances of the major global equity market segments in general, and sectors in particular, very different over this time frame. To understand this it is necessary to break down the period from March 2000 – December 2016 into two cycles: the “weak dollar” cycle from March 24th, 2000 – October 9th, 2007 (I chose these dates arbitrarily as they mark significant peaks for the S&P 500 index), and the “strong dollar” cycle from October 9th, 2007 until December 31st, 2016. Hopefully, by dissecting these cycles within the cycle can we better gauge where we stand today in terms of equity valuations and how investors might approach the allocation of their portfolios in light of them.
In this article, I will demonstrate the following:
1. Global equity returns, when comparing similar industries and companies, are far more similar than many realize, as the tendency is to focus on big-picture aggregations, such as country and sector indices, which have distorted compositions and thus useless valuation metrics.
2. Currency fluctuations have a dramatic impact on relative global equity returns, particularly between two markets or two sectors that have largely different compositions, and vastly different sensitivities to currency movements.
3. For global investors, due diligence is required in the way of data dis-aggregation or index and sector “unbundling,” to get the clearest picture possible of global equity valuations, and thus identify opportunities.
4. Though currency fluctuations do heavily influence the relative performances of foreign and domestic equities, opportunities abound for those who seek them, regardless of where the market is in terms of currency cycles.
“Weak Dollar Period:” March 24th, 2000 – October 9th, 2007
The long secular bull market for the S&P 500 that began in the early 1980s peaked on March 24th, 2000, marking along with it the peak of the tech bubble that saw the technology sector grow from 6.3% of the index’s weighting in 1990 to more than 20%. It would take several years for the froth of the tech bubble to wear off; from the peak on the 24th of March of 2000 until the next notable top on October 9th of 2007, the tech sector would decline roughly 55% on a cumulative basis. Little wonder, then, that the S&P 500 index cumulatively returned about 16% over this period, certainly a disappointing performance for investors who had grown accustomed to double-digit annual gains in the prior two decades.
While the main U.S. equity market indices languished for most of this period, global investors fared much better, with the MSCI EAFE index (Europe, Australasia, and Far East) crushing the S&P 500, returning a cumulative 67%. Emerging markets did considerably better, returning more than 200%. Investors, – long since trained to think of markets in aggregate terms, and conditioned to view the disparate global equity segments – U.S., foreign developed (ex-USA), and emerging markets (EM) – almost like asset classes wholly distinct from each other, – could not be blamed if they drew the conclusion that the cycle had turned, and investing overseas was the new path to certain prosperity.
A closer look, however, would reveal that much of the difference in gains between U.S. equities and foreign/EM was aided by a steep decline in the real trade-weighted value of the U.S. dollar, which fell about 30% peak-to-trough over the period. The other distinct advantage of the major foreign equity markets over this period was their large exposure, by virtue of much heavier energy and commodity weightings, to the commodities “super cycle,” which saw everything from gold and oil, to uranium and copper explode in value as the dollar plummeted. An investor in foreign energy would have won twice, effectively: he would have benefited from the rise in the price of oil, which would naturally benefit his oil-related shares, and also when his earnings were translated back into weaker dollars. Due to the extreme sensitivity of EM markets to dollar movements, the effect would have been even greater. This ‘double effect’ on the differences in performance across the various market segments can plainly be seen by comparing cumulative returns, particularly in the sectors most sensitive to a weaker dollar and the commodities boom: energy and materials (Note: For S&P 500, I use S&P 500 sector data; all else is MSCI sector data; all returns in USD):

It can be clearly seen that U.S. energy stocks did almost as well as developed foreign energy stocks, the main difference likely being due to currency effects. EM energy dwarfed them both, probably the result of lower starting valuations after the problems in many EM countries in the late 1990s, and also because dollar movements tend to have magnified impacts on EM shares.
What it also reveals is that global information technology and telecom, with the exception of EM telecom, did poorly across the spectrum, as the effects of the global technology bubble had to be worked off with time. The U.S. was not an outlier here; the tech and telecom bubbles were global phenomena, so a period of broad weakness should be expected after so much of the sectors’ future returns were priced into the lofty valuations seen at the bubble’s peak.
Obviously, in the wake of a huge technology bust, an index like the S&P 500, top-heavy with tech names, would fare far worse than an index like the EAFE, which averaged a technology sector weighting about half that of the S&P 500 over the 2000 – 2007 period. Conversely, the S&P had a combined average weighting of only 11% to energy and materials over this same time frame, while the EAFE had much greater exposure to these commodity-related industries, with a combined average annual weighting of about 16%.
Digging deeper, we can take a closer look at differences in the composition of the various materials sectors. At first glance, one would think that the U.S. materials sector would be very similar to that of the rest of the developed world or even the emerging market sphere, yet that is not the case. Indeed, even though each sector is generally classified under ‘materials’ for ease of classification, the components are very, very different.
For example, in the U.S. the MSCI Materials Index, which trailed its EAFE and EM counterparts during the commodities boom, is heavy in industrial chemicals and other economically sensitive subsectors (charts via MSCI):

On the other hand, the comparable MSCI index for developed world ex-USA materials is more concentrated in commodities and steel:

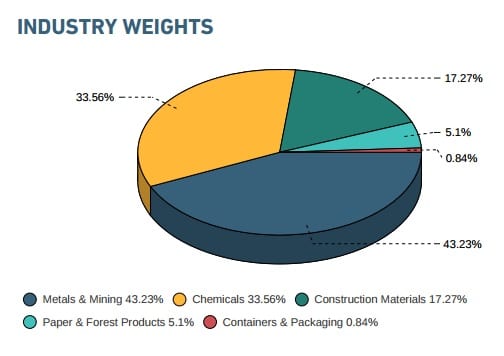
Finally, in the MSCI EM materials index, metals and mining make up more than 40% of the index:

Not only does this explain a large part of the differences in performance over the same cycle, it also explains why the U.S. Materials index is reported as valued at 18 times’ next year’s earnings, versus 14 for the ex-USA materials index, and only 11.6 for the EM materials index. On the surface, they all be classified as “materials” companies, but they are actually quite different.
Importantly, this distinction can be seen in many other sectors as well. For example, in the U.S. consumer discretionary space, 20% of the germane MSCI index is in internet retail, 13% of which is Amazon.com. Conversely, in the comparable ex-USA and EM consumer discretionary indices, automobile manufacturers constitute 26% and 31%, respectively. Unsurprisingly, the U.S. index appears expensive at 5 times’ book value, compared to sub-2 price-to-book valuations for ex-USA and EM.
If this were not enough evidence to demonstrate the impact of sector and industry weighting on index performance and valuation, perhaps an examination of the U.S., ex-USA, and EM markets on a more level playing field would be helpful.
By equal-weighting market components, we can reduce the impact of concentration among sectors in terms of skewing returns. At first glance, however, it does not seem like it would have made a huge difference. After all, even by this measure, the U.S. still finished last:

However, by comparing the equal-weighted indices versus the market-capitalization weighted indices shows that disadvantageous weightings, particularly to the technology sector, played a far larger role than one might think in the lackluster U.S. equity performance over the March 2000 – October 2007 cycle:

The same exercise, but this time using equal-weighted indices by sector relative to the market-cap weighted indices, yields similar, though less pronounced, results:

In sum, what in retrospect seemed like a weak period for U.S. foreign stocks was actually a terrible period for certain sectors like technology and telecom, and a great period for weak-dollar plays such as metals, mining, and energy.
“Strong Dollar Period:” October 9th, 2007 – December 31st, 2016
The exact opposite of the weak-dollar fueled commodities boom played out over the next cycle, October 2007 – December 2016 as the dollar strengthened in the wake of the global financial crisis, and the commodities super cycle ended:

The market recovery since the financial crisis was led by consumer-oriented, healthcare, and technology shares, which are the largest components of the U.S. market. Those same sectors fared pretty well in the emerging markets and in the developed world, but a strong dollar and weaker domestic economies likely kept them from achieving the triple-digit cumulative returns enjoyed by the U.S.
It is worth noting that while many now are advocating investors sell the “expensive” U.S. and overweight foreign and emerging markets based simply on apparently cheaper valuations, the bulk of the valuation differential resides in the sectors that are least similar in terms of composition, such as consumer discretionary and materials, while the sectors such as consumer staples and healthcare that generated similar returns even during the period of dollar strength are valued much the same:

If you are so inclined, you can go a step further and compare single companies in the same space. You will find that Ford and General Motors are no more richly valued than Toyota or BMW, while airplane manufacturers Boeing and Airbus are similar valued.
Conclusion
The point of this exercise, of course, is to demonstrate that so much of the apparent differences in performance across global equity markets is largely the result of two factors: currency movements, and index composition. Breaking down an index by sector composition is critical in better assessing its value, but that is only the first step in a global investor’s due diligence process. In the age of indexing and indiscriminate investing, individual security analysis is frowned upon as ‘stock picking,’ but it is critical for investors to unbundle market aggregations such as indices so that they know what exactly it is that they are buying.
Consider the following: you are a sector index investor, and you are alarmed at the huge premium enjoyed by the U.S. consumer discretionary space. Based on apparent valuation alone, the logical choice would be to sell the U.S. consumer discretionary index, and buy the comparable ex-U.S. or EM index. However, if you took the index aggregation out of the equation, and thought of it as what it really is – a collection of companies – would you really be so eager to sell Amazon, a company without peer in the global retail space, and buy a pool of automakers, which are players in a space overly competitive as evidenced by 0% financing for new car purchases?
The reality is, – and I am sure this will draw the ire of many valuation bears, – that global equity valuations are not really all that different when you compare, for example, a tobacco maker to a tobacco maker, and a gold miner to a gold miner. The data actually reveal that, with few exceptions. In a truly global economy, all the major players are subject to the same headwinds, be they geopolitical, currency-related, or what have you. It is intellectually lazy to proclaim, only in the most general of terms, that X market is expensive, or Y market is cheap. It is also absurd to claim that most foreign equity markets are comparable to the U.S. in the aggregate, when they clearly are not, only to justify a proclamation that one is richly valued, and the other is reasonable.
No matter where we stand in the macro cycle of currency movements and commodities booms and busts, there are always attractive assets around the world, such as publicly traded airports, which exist as opportunities only in the marketplace outside the U.S. Opportunistic investors should want to seek out these possibilities, perhaps by building a truly global portfolio of the best brands in a given sector, no matter where they are domiciled. In the long run, this is likely to be a more rewarding strategy than blindly buying into somewhat indiscriminately assembled aggregations of companies that are merely “close enough” when it comes to similarities required for index categorization.
Appendix: Additional graphs of relative performance, both “strong dollar cycle,” and “full cycle”


Disclosure: The results are hypothetical results and are NOT an indicator of future results and do NOT represent returns that any investor actually attained. Indexes are unmanaged, do not reflect management or trading fees, and one cannot invest directly in an index.
This writing is for informational purposes only and does not constitute an offer to sell, a solicitation to buy, or a recommendation regarding any securities transaction, or as an offer to provide advisory or other services by Fortune Financial Advisors, LLC in any jurisdiction in which such offer, solicitation, purchase or sale would be unlawful under the securities laws of such jurisdiction. The information contained in this writing should not be construed as financial or investment advice on any subject matter. Fortune Financial Advisors, LLC expressly disclaims all liability in respect to actions taken based on any or all of the information on this writing.