There is a lot of angst these days about the stock market, with the usual suspects calling for a crash that will dwarf those of 2000 and 2007. The purpose of this article is not again to refute those naysayers, but to show two very important distinctions, – one fundamental, the other technical, – between today’s market, and the markets of the two most recent significant peaks.
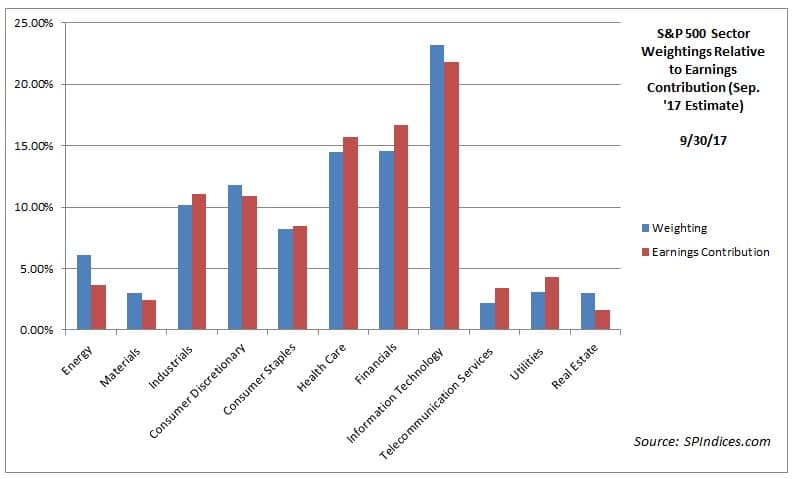
Fundamentally, as gauged by the S&P 500, the market’s capitalization weighting by sector appears to be fundamentally in-line with the earnings contributions of those sectors. Using the most recent quarterly data, one can see that the biggest disparity between market representation and earnings power is in the energy sector, with about a 2.5% difference between energy’s capitalization weighting in the index and its earnings contribution. The rest of the sectors are weighted roughly even with their earnings contributions:

This stands in stark contrast to 2006 (the last full year before the market peaked in October of 2007), when huge disparities existed in energy and financials, which, in retrospect, were the products of bubbles in those two sectors, which served to inflate their earnings:

2017 pales in comparison to 1999, the last full year of the tech bubble, when the value of technology shares far outpaced their fundamental contribution, while financial stocks were relatively underrepresented according to their profit share:

Today’s market is also very technically different from these prior years. For example, in 2000, the New York Stock Exchange’s Advance-Decline line, a good measure of market breadth, peaked in early 1998 and subsequently declined for months while the S&P 500 continued to notch new highs, powered increasingly by few but heavily-weighted large-cap tech stocks:

In 2007, the New York Stock Exchange Advance-Decline line peaked in August 2007 (see highlighted area on chart), and failed to make a new all-time high, even as the S&P 500 did just that two months later. In retrospect, the lack of breadth in the market should have been a warning that that particular bull market was getting long in the tooth:

Today, both the overall stock market and the S&P 500 are showing exemplary strength, with both measures showing broad participation in the seemingly relentless advance of thte stock market:

In sum, there are many reasons to be fearful: unlike previous peaks, valuations are uniformly high, and interest rates historically low, leaving investors with few lucrative places to hide. Yet, according to these measures, today’s market, seems to be on solid footing and technically sound. There does not seem to be a reason for equity investors to panic just yet.
